
Spring has arrived in Denver — and so has a market that finally feels like it has found its footing. After years of whiplash, from the frenzy of 2021 to the rate shock of 2023, the Denver metro is entering April 2026 with something we haven’t seen in a long time: stability. Prices are holding. Inventory is building. Buyers are active. And sellers who price correctly are still getting strong results. This is the first in a monthly series where I break down what the numbers actually say — no spin, no hype, just what you need to know if you’re buying, selling, or simply watching the market.

Watch the Full April Market Breakdown
The Headline Numbers for April 2026
Let’s start with the top-line data for the Denver metro. These are the numbers that define the market right now:
| Market Metric | Current Figure | Context |
|---|---|---|
| Median Single-Family Price | ~$585,000 | Stable year-over-year |
| 30-Year Fixed Rate | 6.46% | Down from 6.64% a year ago |
| Active Listings | 8,200+ | Up ~7% year-over-year |
| Avg. Days on Market | 41 days | Up from 36 a year ago |
| Close-to-List Price Ratio | 97.94% | Buyers negotiating modestly |
| New Listings Year-Over-Year | +18% | More inventory entering the market |
That 97.94% close-to-list ratio tells the real story. Sellers are still getting very close to their asking price — but the days of routinely closing at 103–108% over list are behind us. Well-priced homes are selling. Overpriced homes are sitting.
Inventory Is Rising — and That Changes the Game
The biggest shift in this spring market compared to 2024 is inventory. Active listings are up 7% year-over-year, and new listings coming to market are up 18%. That’s meaningful. More supply means buyers have real choices again, and sellers can no longer assume that simply listing a home will trigger a bidding war.
Forty-one days on market is not a crisis — it’s actually very close to the long-run historical average for Denver. But for sellers who remember the five-to-ten-day madness of 2021, it requires an adjustment in expectations. Homes that are priced right, presented well, and marketed properly are still moving. Homes that are priced aspirationally are accumulating days on market and eventually chasing the price down.
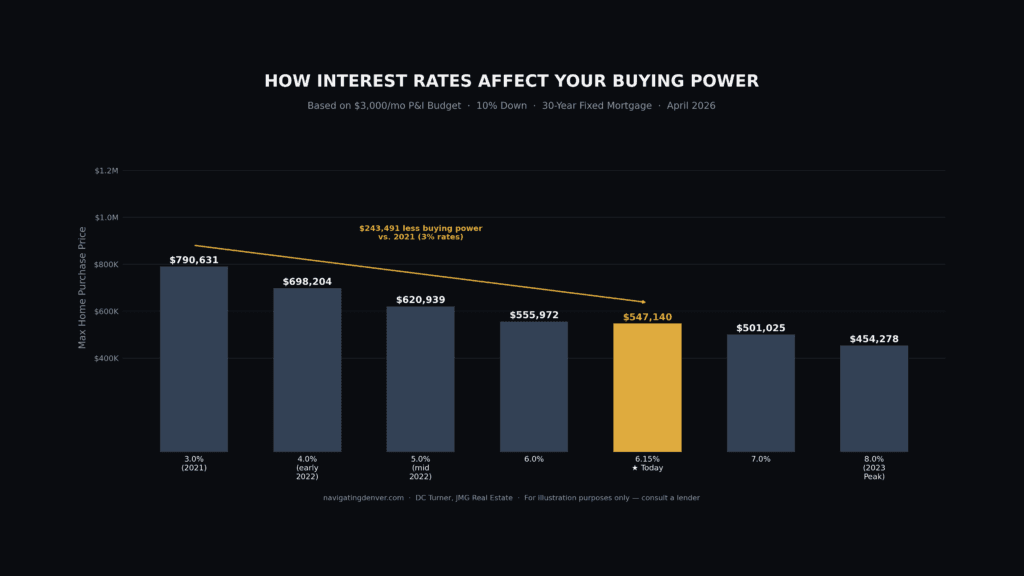
Mortgage Rates: Where We Are and What It Means
At 6.46% on a 30-year fixed, rates are down from their peak of around 8% in late 2023 — but they’re not back to the 3% environment that made the 2020–2021 market go vertical. Buyers have largely accepted that reality, and activity in the spring 2026 market reflects it.
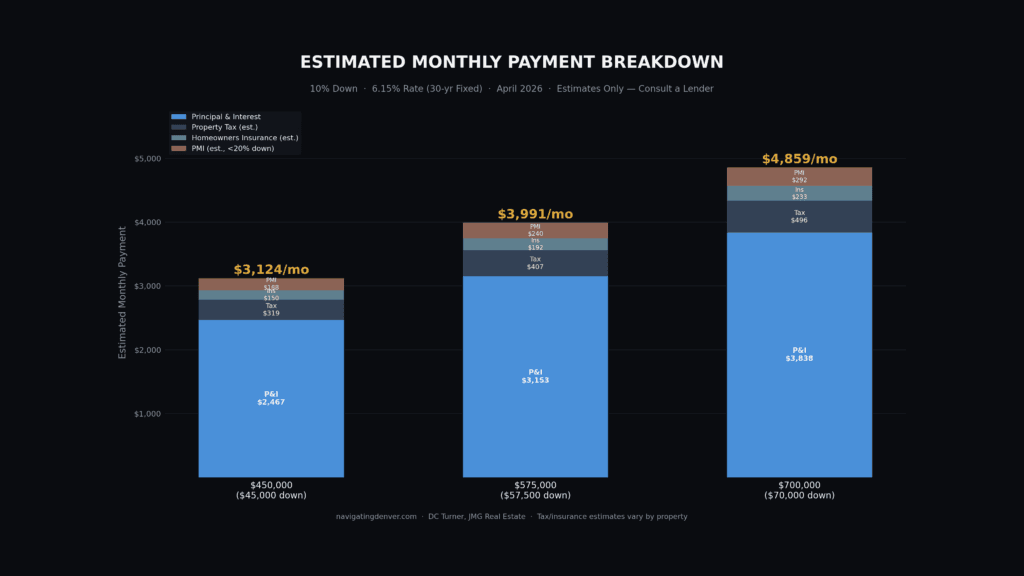
Here’s what a rate of 6.46% actually looks like in practice on Denver-area price points:
| Home Price | Down Payment (10%) | Loan Amount | Est. Monthly Payment |
|---|---|---|---|
| $450,000 | $45,000 | $405,000 | ~$2,545/mo |
| $585,000 | $58,500 | $526,500 | ~$3,310/mo |
| $750,000 | $75,000 | $675,000 | ~$4,241/mo |
Estimates based on 6.46% rate, principal and interest only. Taxes, insurance, and HOA not included.
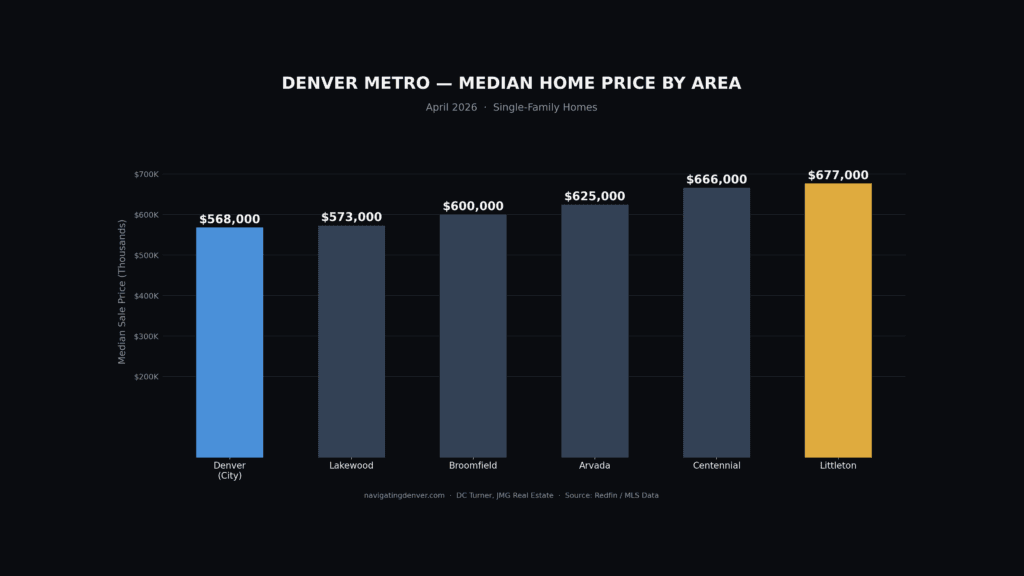
How Key Submarkets Are Performing
The metro-wide median is useful context, but Denver is a collection of distinct markets. Here’s a snapshot of how the six submarkets covered in this series are tracking:
Denver City — The urban core continues to see softness in the condo segment while single-family demand remains solid. Buyers who have been priced out of the suburbs are looking here.
Arvada — One of the more active markets in the metro right now. The combination of walkable Old Town, good schools, and relatively attainable price points is driving consistent demand.
Broomfield — Stable and steady. The north suburban corridor is attracting buyers who want newer construction at a slightly lower price point than Louisville or Lafayette.
Lakewood — Still the best value play closest to the mountains. Demand from outdoor-lifestyle buyers keeps this market competitive, particularly on the west side.
Centennial — Cherry Creek schools continue to anchor demand here. This submarket is performing above the metro average — well-priced homes are still seeing multiple offers.
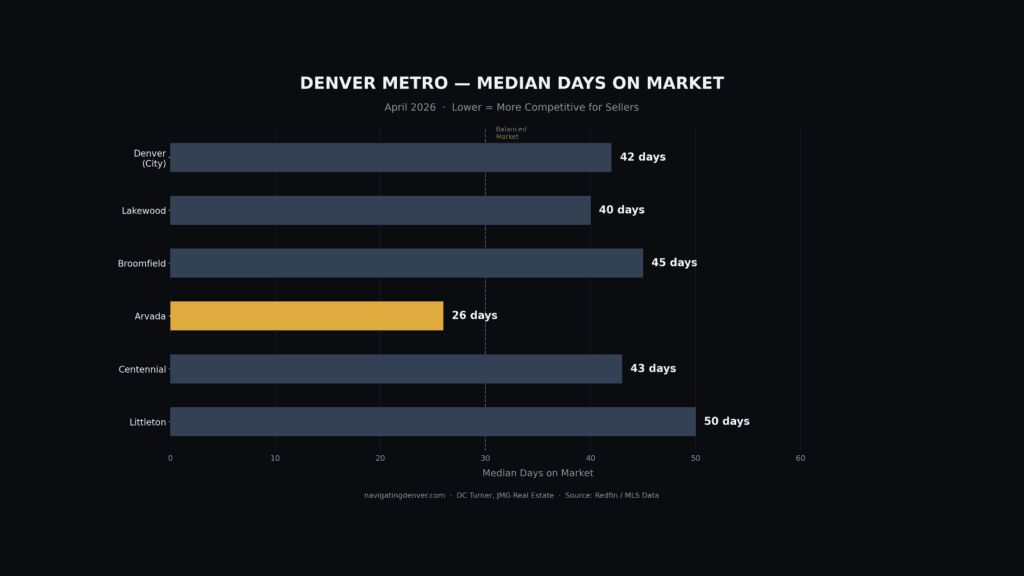
Littleton — A balanced market with good activity. Historic downtown Littleton and access to C-470 make this a consistent performer. Days on market are running slightly below the metro average.
Pro Tip: The spring market moves fast — but not chaotically. Buyers who get pre-approved now and move decisively on well-priced homes are finding success. Sellers who resist the urge to overprice and instead lead with a sharp, strategic number are still walking away with strong results. The market rewards preparation on both sides.
What This Market Means for You
If you’re a buyer:
- Get pre-approved before you start seriously looking — the right home still moves quickly
- Use the extra inventory to be selective, but don’t use rising days on market as a reason to lowball aggressively on well-priced properties
- Run the payment math at today’s rates before you set your price range — don’t let rate shock derail a great opportunity
If you’re a seller:
- Pricing correctly from day one matters more than it has in years — the market will not bail out an overpriced listing
- Presentation is back: staging, photography, and marketing do real work in a competitive inventory environment
- Sellers concessions toward rate buydowns or closing costs are a genuine tool — used strategically, they can get your home sold without reducing your list price

The Bottom Line for April 2026
This is a market that rewards people who show up prepared. Inventory is at levels that give buyers real options. Rates, while not back to historic lows, have stabilized and are trending in the right direction. And prices have held — which means equity built during the run-up years is very much intact for sellers.
If you’re thinking about making a move this spring, the window is open. I’ll have a full May update published in thirty days — but if you want to know what these numbers mean specifically for your neighborhood, your price range, or your situation, reach out directly. That’s a much better conversation than any market report.
Data sourced from REColorado MLS, Freddie Mac, and local market reporting. Figures reflect Denver metro area single-family residential sales through early April 2026. Individual neighborhood and property type results may vary.
Have Questions About This Topic?
Every situation is different. Let’s talk about how this applies to your specific goals in the Denver market. No pressure, no obligation — just straight answers.